Correct Answer

verified
Correct Answer
verified
True/False
Filtering cannot happen independently of cell selection.
B) False
Correct Answer

verified
Correct Answer
verified
Multiple Choice
Which of the following is the path to the 'Add Chart Element' button?
A) (CHART TOOLS DESIGN tab | Analysis group)
B) (CHART TOOLS DESIGN tab | Chart Layouts group)
C) (CHART TOOLS FORMAT tab | Analysis group)
D) (CHART TOOLS FORMAT tab | Options group)
F) A) and B)
Correct Answer

verified
Correct Answer
verified
Short Answer
Which are types of fields used by PivotTables? a. summary b. data c. category d. index
Correct Answer

verified
Correct Answer
verified
Multiple Choice
MATCHING Identify the letter of the choice that best matches the phrase or definition. -Changes to category fields are correspondingly made to these in the PivotTable report.
A) trendline
B) PivotTable report
C) PivotChart report
D) slicers
E) forecasting
F) R-squared value
G) row fields
H) PivotTable fields
I) calculated field
J) column fields
L) C) and J)
Correct Answer

verified
Correct Answer
verified
Multiple Choice
MATCHING Identify the letter of the choice that best matches the phrase or definition. -Graphic objects used to filter data.
A) trendline
B) PivotTable report
C) PivotChart report
D) slicers
E) forecasting
F) R-squared value
G) row fields
H) PivotTable fields
I) calculated field
J) column fields
L) C) and J)
Correct Answer

verified
Correct Answer
verified
Multiple Choice
In a PivotTable, ____ fields correspond to summary values of original data across categories.
A) category
B) index
C) data
D) summary
F) B) and C)
Correct Answer

verified
Correct Answer
verified
True/False
PivotTable rows are drawn from columns in the worksheet data.
B) False
Correct Answer

verified
Correct Answer
verified
True/False
Excel needs the blank rows above a PivotTable to remain blank, for any filters added in the PivotTable Fields task pane.
B) False
Correct Answer

verified
Correct Answer
verified
Short Answer
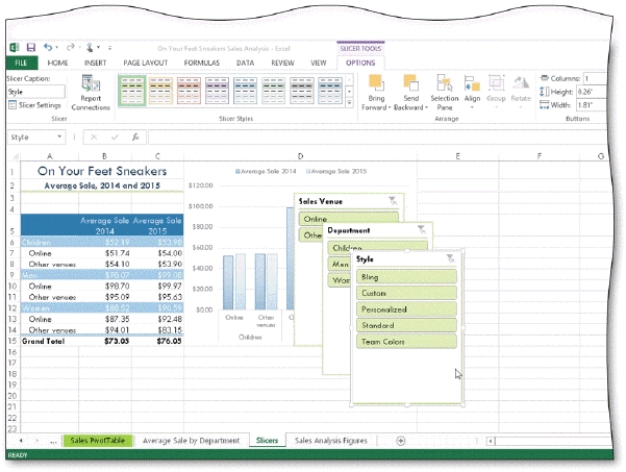
 -As shown in the accompanying figure, _________________________ are graphic objects that contain buttons you tap or click to filter the data in PivotTables and PivotCharts.
Correct Answer

verified
Correct Answer
verified
True/False
Today, data are increasingly available from a wide variety of sources and gathered with much more ease.
B) False
Correct Answer

verified
Correct Answer
verified
Short Answer
The Field Headers button is located in the _________________________ group on the PIVOTTABLE TOOLS ANALYZE tab.
Correct Answer

verified
Correct Answer
verified
Multiple Choice
You can add a trendline to all of the following EXCEPT a(n) ____ chart.
A) inventory
B) pie
C) scatter
D) bubble
F) A) and D)
Correct Answer

verified
Correct Answer
verified
Multiple Choice
Which of the following is the path to the +/- Buttons button?
A) (PIVOTTABLE TOOLS DESIGN tab | Show group)
B) (PIVOTTABLE TOOLS ANALYZE tab | Show group)
C) (PIVOTTABLE TOOLS FORMAT tab | Show group)
D) (PIVOTTABLE TOOLS DISPLAY tab | Reveal group)
F) A) and C)
Correct Answer

verified
Correct Answer
verified
Multiple Choice
The summary function that calculates the number of data values in a PivotTable report is ____.
A) Count
B) Product
C) Var
D) Count Nums
F) C) and D)
Correct Answer

verified
Correct Answer
verified
True/False
The default chart type for a PivotChart is a 2-D Line chart.
B) False
Correct Answer

verified
Correct Answer
verified
Short Answer
When creating a PivotChart report, you select the chart type and subtype in the __________________________ dialog box.
Correct Answer

verified
Correct Answer
verified
Short Answer
_________________________ can represent changes in one set of data with changes in another set of data.
Correct Answer

verified
Correct Answer
verified
True/False
Before you add a trendline to a chart, you need to determine the data series to analyze.
B) False
Correct Answer

verified
Correct Answer
verified
Multiple Choice
____ reports are visual representations of PivotTables.
A) PivotChart
B) Slicer
C) Data Marker
D) Calculated field
F) C) and D)
Correct Answer

verified
Correct Answer
verified
Showing 41 - 60 of 112
Related Exams